Introduction
Visual Studio Code is a lightweight code editor with a lot of powerful capabilities. If you like Visual Studio, this is quite similar but without the abhorrent load times. It’s available for the main operative systems and includes built-in support for JavaScript. It has a rich ecosystem of extensions that extend support to other languages such as C#, Java, Python, and SQL, as well as runtimes like .NET and Unity.
It ships with great features such as IntelliSense, debugging and in-product source control.
Explorer
Use Ctrl+B to toggle the sidebar, where you can find the main functionalities. In Code, you work in directories or folders where your source code lives. The explorer allows for quick access and manipulation of the files in your project. You can use Ctrl+P to open files in your folders faster.
Search
Search files and inside of them. Match whole words or substrings, toggle case-sensitive search, use regex, and filter for different file types.
You can launch the search and replace feature from this pane, as well as by using Ctrl+F.
Source control
You can integrate with both Git and Microsoft’s TFVC (Team Foundation Version Control), although the latter needs to be installed. By opening a folder that’s mapped to a TFVC repository, you can automatically check folders in and out, write your commit messages, view your work items or tasks and associate commits to them, all from inside the editor.
Debugger
Launch the debugger panel by pressing Ctrl+Shift+D and click the little configuration icon to create a debugging task. The editor detects your debugging environment automatically, but if this fails you can manually choose it. Next, you can set breakpoints wherever you want your program to stop and press F5 to start debugging. Now, you can inspect the status of all your variables and functions, examine their values and attributes, at any point in your file.
In the panel you will see four main areas:
- Variables: contains all of the existing variables in your program.
- Watch: this contains those variables that you have flagged for further inspection, so that they are easy to find.
- Call Stack: this explains how the program got to where it currently is.
- Breakpoints: here you can see any breakpoints that you have set and quickly refer to them to disable, enable, or reapply them.
Breakpoints are set by clicking on the gutter of your file or by pressing F9 and they stop the execution of your program.
You can change a breakpoint to also be a log points, that is, some info will be logged to the console when the program execution reaches that point.
When debugging, you can take a few actions that are know as “stepping through code”:
- Step over: this will step over a given line, meaning that if the line contains a function, it will be executed and the result returned without debugging each line.
- Step into: if the line you are going to step into contains a function, the debugger will enter it and continue working line by line. Otherwise it will behave as step over.
- Step out: this takes the debugger to the line where the current function was called.
You can also launch an interactive debugging console with Ctrl+Shift+Y.
This is just a subset of the debugging capabilities of VS Code, and the topic deserves a course on its own.
Extensions
One of the killer features of Code. The Visual Studio marketplace is community-sourced and you can make your own extensions with JavaScript or TypeScript. There are loads of useful features in extensions, but take into account that every extension that you install with have a small impact in the performance of your editor. Also, they bloat the %APPDATA% folder in your roaming profile, making your machine start up a lot more slowly.
As a workaround, you can write a one line batch file that loads the editor’s metadata from a location outside the roaming profile where you have previously placed the Code folder.
For example, my setup is as follows:
1 | |
Save this with a .bat extension and place it in your desktop. Next time you open VS Code, you can do it from that icon.
It’s not the most elegant solution, but it works in corporate machines.
Alternatively, check the portable version of VS Code.
They can also be enabled or disabled whenever necessary at the user or the workspace level.
Integrated Terminal
You can open several terminals in different languages, stack them on top of each other or put them to the side. You can use Ctrl+` (or Ctrl+Ñ) to toggle it.
The command palette
Press Ctrl+Shift+P to launch the palette. This is, by far, the most important keyboard shortcut in VS Code because it allows access to every existing command in the editor. Just launch it, and start typing what you want to do.
Customization
Themes and icons
There are many, many different themes for VS Code and you can make your own ones as well. This is very useful when programming for long stretches of time, or when light reflects against your monitors. The keyboard command to change themes is Ctrl+K, Ctrl+T and is obviously one of my most used ones!
Some of the themes I personally like:
| Light | Dark |
|---|---|
| Winter is Coming | 1984 |
| Slack Theme | Monokai |
| Quiet Light | Fairyfloss |
| Ayu | Synthwave |
| Noctis | Nord |
You can also use different icon themes, which make your files easier to find in the explorer pane while making it more appealing to look at!
You can go to Preferences -> File Icon Theme to change it, or of course use the all-powerful command palette.
Some of my favorites are:
- Material Icons
- VS Code Icons
- Ayu Icons (bundled with the Ayu theme)
You can also find an extension that changes your file icons and instead shows Nicolas Cage’s face.
Please use at your own risk.
Every one of these changes and customizations are saved to the user preferences, which are reachable via Ctrl+, or the command palette. You can view them in a nice UI or in JSON format.
For example, you can see that I have custom setting for workbench.colorTheme and workbench.iconTheme. I also have window.zoomLevel set to -1 because I zoomed out with Ctrl+-
Note that settings can be applied globally at the user level or relative to a workspace.
Some configuration options that I think are quite nice and improve collaboration and development rythm:
| Option | Description |
|---|---|
"editor.minimap.enabled": false |
Removes the minimap shown at the right side of the editor. |
"explorer.confirmDelete": false |
Deactivates the warning before deleting a file. |
"explorer.confirmDragAndDrop": false |
Removes warning when moving files in the explorer. |
"editor.formatOnSave": true |
Automatically formats your code on save event. |
"editor.formatOnPaste": true |
Automatically formats your code when you paste it. |
"javascript.format.enable": true |
Enables a JS formatter, such as Prettier. |
"editor.multiCursorModifier": "alt" |
Selection of multiple line when holding Alt and clicking. |
"files.trimTrailingWhitespace": true |
Deletes whitespace in files. |
"editor.quickSuggestionsDelay": 0 |
Show code actions without delay. |
"tfvc.location": "path\\to\\tf.exe" |
Tell Code where to find the Team Foundation executable. |
"powermode.enabled": true |
This is the best setting ever, better than Power BI fish visuals. Try it yourself! |
There are much more settings that you can tweak, and each extension or language has their own settings. Change, mix and swap them to find the setup that works best for you!
Fonts
You can also use a custom font if you wish to. Make sure the .ttf file is installed in your system and set your preferred font in the settings.
I (and many other developers) use Fira Code because it has nice ligatures and doesn’t cost $200.
Workspaces
A VS Code workspace is not a folder, or a working directory. It is a list of a project’s folders and files and can contain multiple working directories. You can save settings or disable extensions at the workspace level and they take precedence over the user settings. They are a bit like Visual Studio’s solutions.
You can create one of these workspaces by going to File -> Save Workspace as..., or just type workspace in the command palette to see all the available options.
Editing evolved
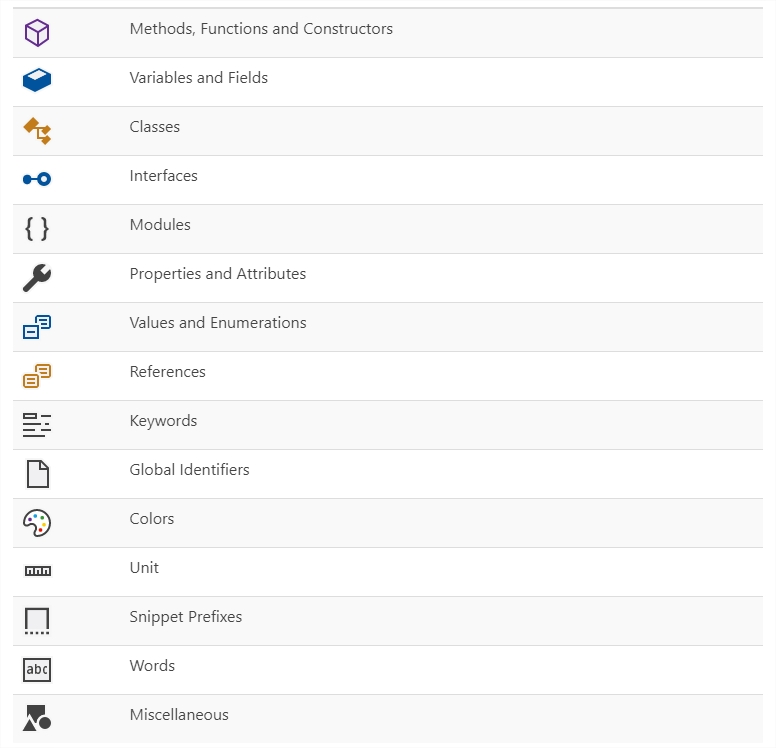
IntelliSense
IntelliSense is awesome, and its capabilities get augmented by Microsoft’s IntelliCode extension which leverages AI to improve code completion.
In summary, the service provides code completion based on language semantics and your source code. The suggestions (variables, functions, methods…) pop up as you type and get filtered as you continue typing. You can bring up IntelliSense in any editor window by pressing Ctrl+Space or by typing a trigger character such as the dot character (.) for JavaScript class methods.
You can also see quick info on each of the suggestions, such as the definition of a variable or function, the expected parameters for a function or the documentation of a class or object.
 |
|---|
| Types of IntelliSense Completion. From https://code.visualstudio.com/docs/editor/intellisense. |
Code formatting and navigation
Aside from formatting on paste and save as mentioned in the settings section, you can also use the commands Format Document or Format Selection whenever needed, from the command palette or by right clicking the editor window.
Navigating your files is much faster and easier with Code, for example:
* You can jump directly to the definition of any function or variable, no matter where it is in your codebase.
* You can also peek at its definition, maintaining your current position in the document.
* You can also rename every occurrence of a symbol just by pressing F2 with the cursor on the symbol.
Errors, warnings and info
You can find these in the problems tab, which can be activated with Ctrl+Shift+M. These problems are usually underlined in your code in different colors depending on the problem level.
You can loop through them by pressing F8 or Shift+F8 which will also provide an inline window with details about the problem.
Keyboard shortcuts
These are a very nice productivity aid that help developers avoid moving their hands back and forth between the keyboard and the mouse. While it might seem a negligible time, it’s quite common to do several times every hour and it accumulates towards the end of the day.
There are a lot of keyboards shortcuts and its quite impossible to remember them all. Thankfully, there is a very handy reference and you can remap your shortcuts very flexibly to better match your work process.
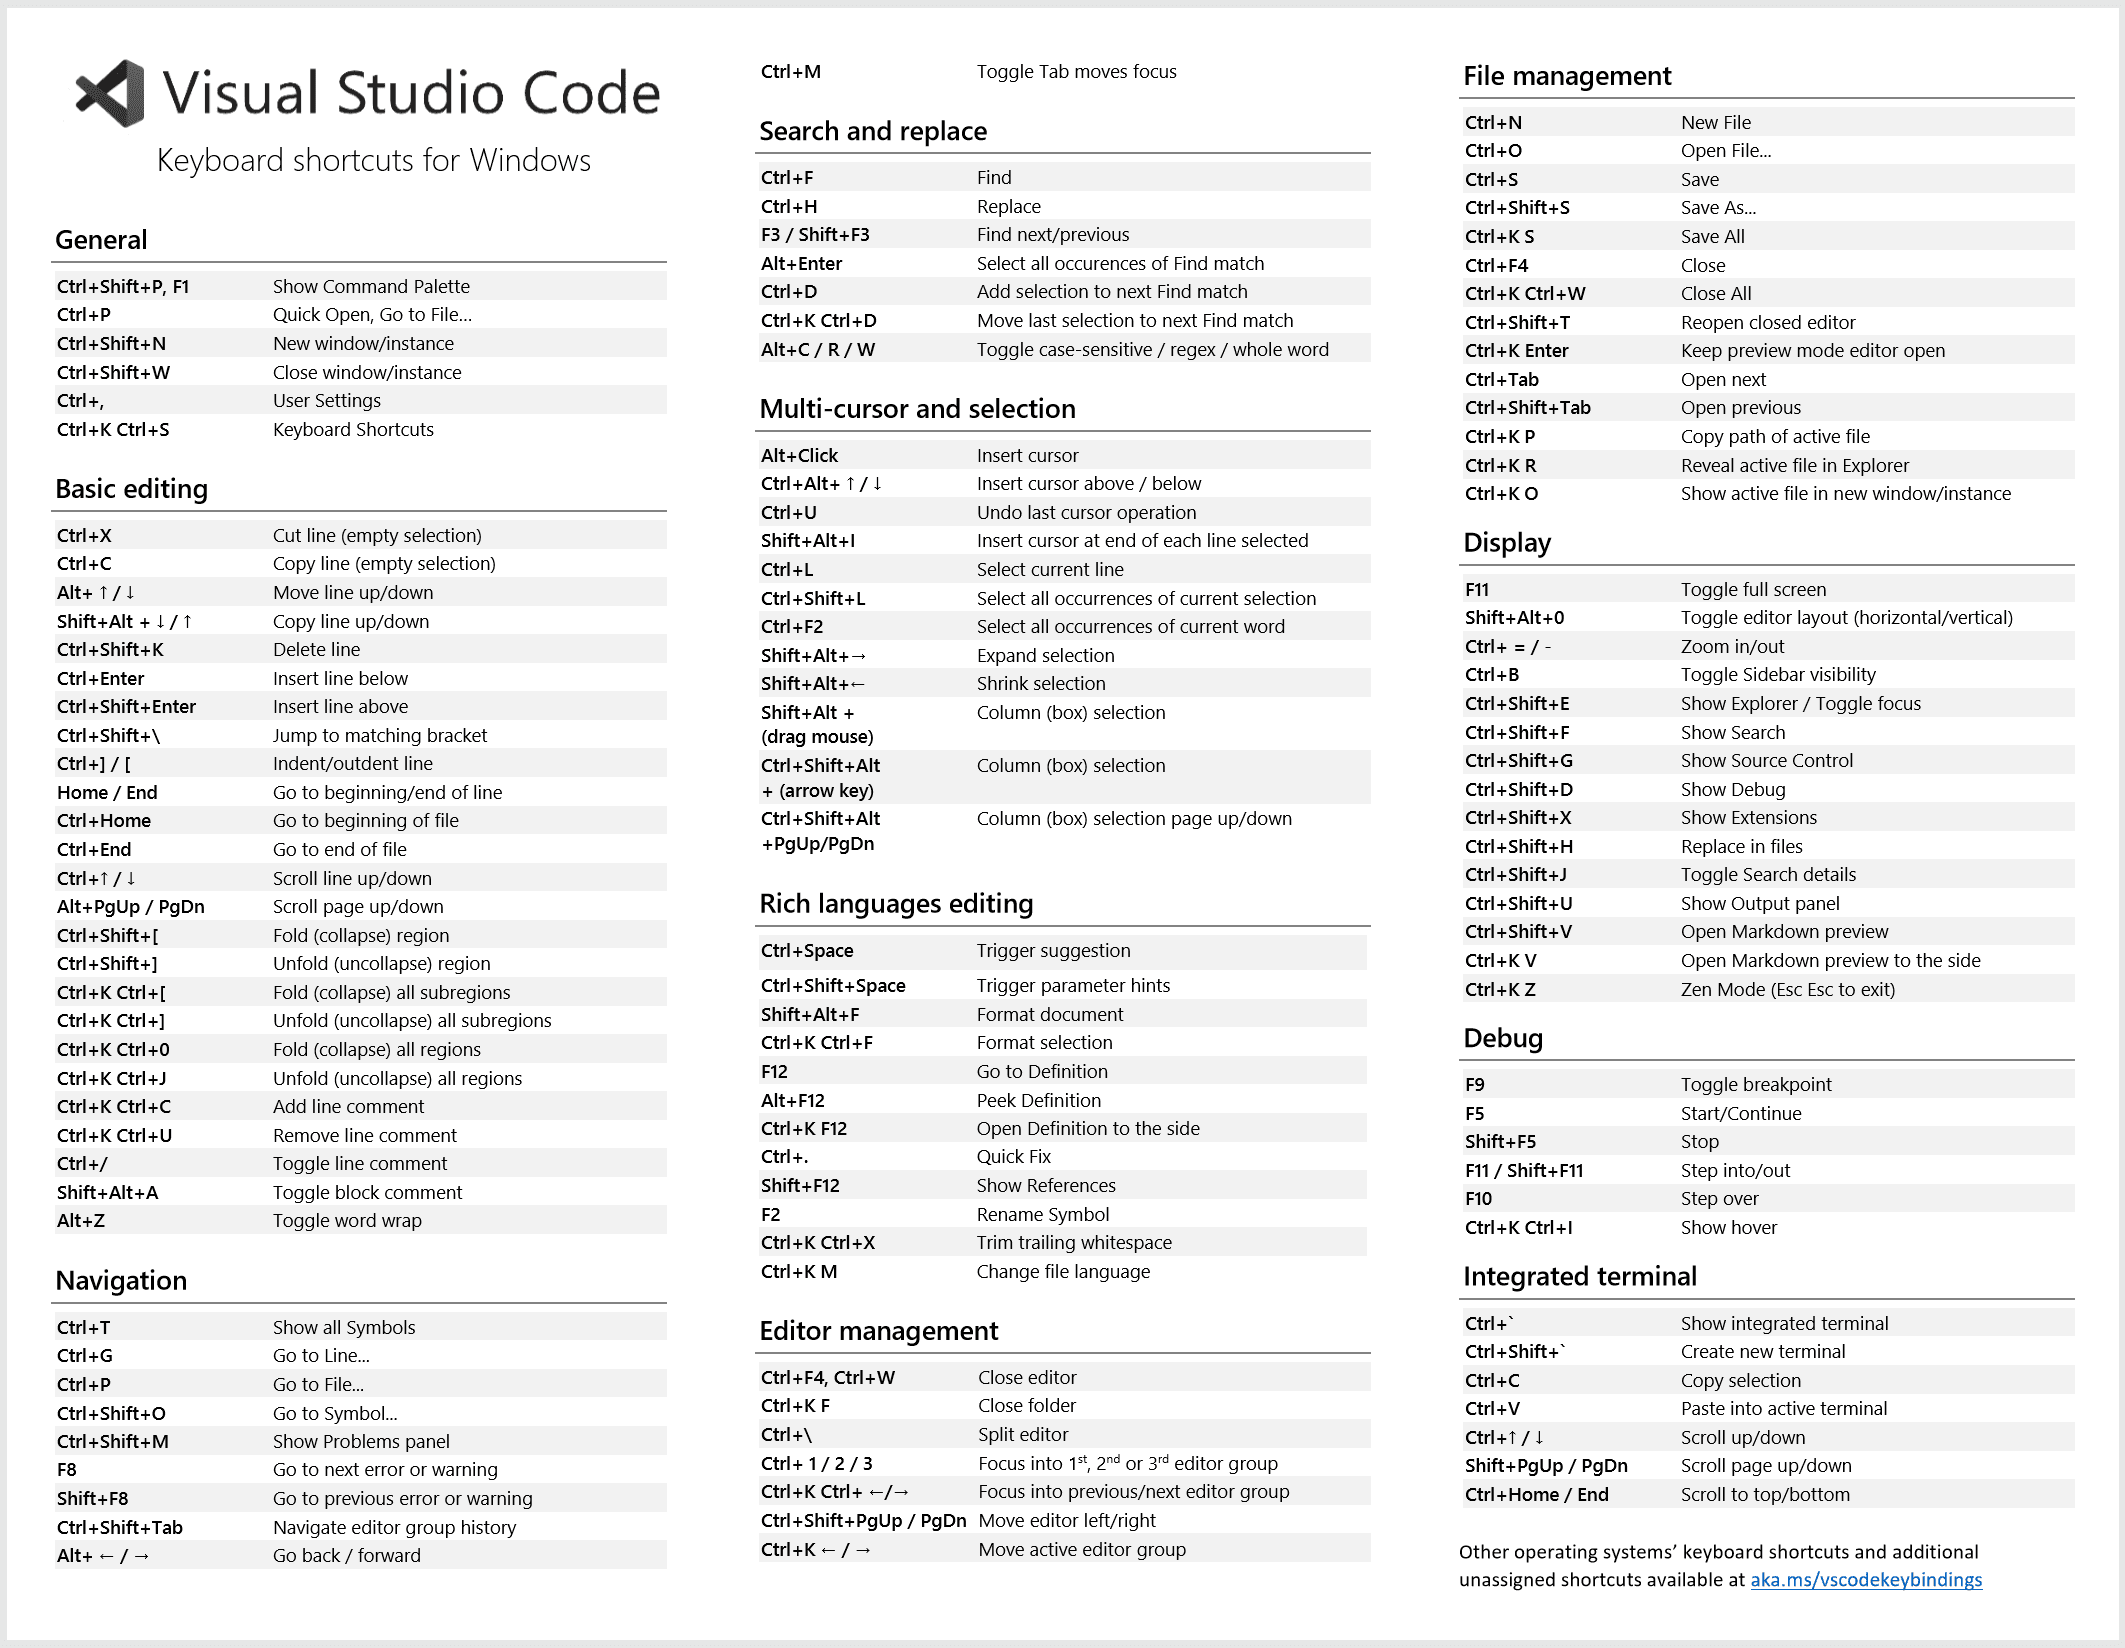
Some of my recommendations and most used keyboard shortcuts:
| Shortcut | Description |
|---|---|
Ctrl+Shift+N |
Open a new Code instance. Use it when launching from custom folder. |
Ctrl+Shift+Tab |
Shows you active files in the editor. |
Shift+Alt+↑/↓ |
Copy current line above/below. |
Alt+Click |
Insert cursor. |
Shift+Alt+I |
Insert cursor at the end of each selected line. |
Shift+Alt+(drag mouse) |
Column or box selection. |
Ctrl+G |
Opens the command palette to let you enter a line number to go to. |
Ctrl+Shift+O |
Shows the list of symbols found in the current file. |
Alt+->/Alt+<- |
Switch between open files. |
Alt+Ç |
Toggle line comment. |
Ctrl+K, Ctrl+T |
Change color theme. |
Ctrl+X / Ctrl+C |
Cut or copy entire line, if you have empty selection. |
Ctrl+Shift+/ |
Jump to matching bracket. |
Shift+Alt+F / Ctrl+K, Ctrl+F |
Format document or selection. |
F12 |
Go to symbol definition. |
Ctrl+\ |
Split editor. |
Shift+Alt+0 |
Toggle editor layout between horizontal or vertical. |
Ctrl+K, Z |
Enter Zen mode. Double press Esc to exit. |
Ctrl+´ |
Show the terminal. Ctrl+Ñ in Spanish keyboards. |
Ctrl+K, P |
Copy path of the active file. |
Ctrl+K, R |
Reveal the active file in the system explorer. |
This is just a very small subset of commands, and only for the base VS Code. Extensions add new features which can also be mapped to any shortcut keymap.
Note that some shortcuts have different key chords.
Ctrl+K, Ctrl+Tis not the same asCtrl+K, T. The latter means that you need to press the second key whileCtrlis not pressed down.
Code snippets
This is another very cool feature not unique to Code, and many languages already come with ready-made snippets for you to use. You can also, of course, author your own snippets. Just type “snippet” in the command palette and you will see available options. You can set a snippets file for each language or a common file for a given user, with snippets in many languages.
Some examples of useful snippets would be a TRY-CATCH block in T-SQL or a for-loop in JavaScript.
Extensions showcase
| Extension | Description |
|---|---|
| Azure Repos | Connectivity to Azure Repos and Team Foundation Server. |
| Better Comments | Improved comment functionality. |
| Bracket Pair Colorizer | Better code readability. |
| Code Time | Measures your coding frequency, volume and speed. |
| ESLint | JavaScript linting, needs ESLint library installed. |
| GitLens | Supercharged version control, Git only. |
| Live Share | Remote collaboration within VS Code. |
| Settings Sync | Synchronize settings across different machines. |
| Polacode | Take beautiful screenshots of your code. |
| Prettier | Automatically format your files. |
| SQL Server | Integration with Microsoft’s SQL Server. |
| Visual Studio IntelliCode | AI powered IntelliSense. |
You can also get recommended extensions based on your usage of the editor. For example, I get recommendations for a Markdown linter because I often use that file extension, and for the Notepad++ keymaps because I have that editor installed.