Experiment tracking in machine learning projects is often an afterthought for many practitioners, and it occurs once you’re deep in the modeling process and you have refactor most of your notebooks and scripts. Committing to tracking from the start of the project is sure to make your workflows more structured and reproducible.
Now, you think about using a powerful tool like MLflow, but then comes the setup: the tracking server, the backend store, the artifact root… Suddenly, your quick weekend project feels like a major infrastructure task and you really can’t be bothered with that right now.
I love MLflow and the power of comprehensive MLOps platforms like W&B, but for solo or small projects, they often feel like building the analog of a deep neural network when all you need is a simple (but trusty) linear regression.
So, I built a solution that treats experiment tracking as a local, file-based operation, designed to integrate with Git, not a database. I’m introducing this tool today with its v0.1.0 release: RuneLog.
The Zero-Setup Experiment Tracker
RuneLog is a lightweight, file-based, open-source experiment tracker for Python. It’s built on a simple philosophy: tracking your work shouldn’t be more complicated than the work itself.
There are no servers to run, no databases to configure, and minimal dependencies. All you do is pip install runelog, import it, and start logging.
Who is RuneLog for?
RuneLog is built for the solo engineer, the data scientist prototyping a new model, the student learning the ropes, or the small team that needs to track work without the overhead of a dedicated server.
If you value speed, simplicity, and a workflow that integrates with tools you already use like Git, then RuneLog is for you. It’s not designed to replace enterprise MLOps platforms, but to be the perfect companion for the 90% of projects that don’t need that level of complexity.
How It Works
RuneLog works by creating a clean, human-readable directory structure for you right in your project folder. Here’s how simple it is to get started:
from runelog import get_tracker
from sklearn.linear_model import LogisticRegression
from sklearn.datasets import make_classification
from sklearn.metrics import accuracy_score

# 1. Initialize the tracker
# This is the main entry point to the RuneLog library.
tracker = get_tracker()

# 2. Start a new run within an experiment
# If "quickstart-example" doesn't exist, it will be created automatically.
with tracker.start_run(experiment_name="quickstart-example"):
    # Define and log the model's hyperparameters
    params = {"solver": "liblinear", "C": 0.5}
    tracker.log_parameter("solver", params["solver"])
    tracker.log_parameter("C", params["C"])
    print("Logged parameters:", params)

    # Your model training logic
    X, y = make_classification(n_samples=100, random_state=0)
    model = LogisticRegression(**params).fit(X, y)

    # Log the model's performance metric
    accuracy = accuracy_score(y, model.predict(X))
    tracker.log_metric("accuracy", accuracy)

    # Log the trained model file as an artifact
    tracker.log_model(model, "logreg.pkl")
That’s it. Your parameters and metrics are saved in a simple JSON file, and your artifacts are neatly organized. Because it’s all just files, you can easily version your results with Git, which is a huge win for reproducibility.
Tools like MLflow and W&B are incredibly strong and mature, designed for teams and large-scale MLOps. RuneLog is different by design: a lightweight, file-based tool for solo developers or small teams who value simplicity and a zero-setup, Git-native workflow.
It’s not a replacement for those tools, but an alternative for a different use case.
What’s in the v0.1.0 Launch? 🚀
The initial release is focused on creating a solid, simple core. It includes:
- Core API: Includes tracking experiments and runs, logging metrics, parameters and artifacts, and a model registry.
- CLI: A rich command-line interface to quickly view past experiments.
- Streamlit UI: A simple web-based interface for easy visualization.
- Experiment Sweeps: The ability to easily log runs when performing hyperparameter sweeps.
- Custom Exceptions: Clear, specific error messages to make debugging easy.
Beyond the API: A Simple UI and Powerful CLI
Reviewing your logged experiments should be easy and accessible, so the v0.1.0 release includes an awesome CLI for those who love the command line.
# List all experiments
$ runelog experiments list
# See the all runs of a specific experiment
$ runelog runs list <EXPERIMENT_NAME_OR_ID>
# Display a side-by-side comparison of parameters and metrics for two or more runs
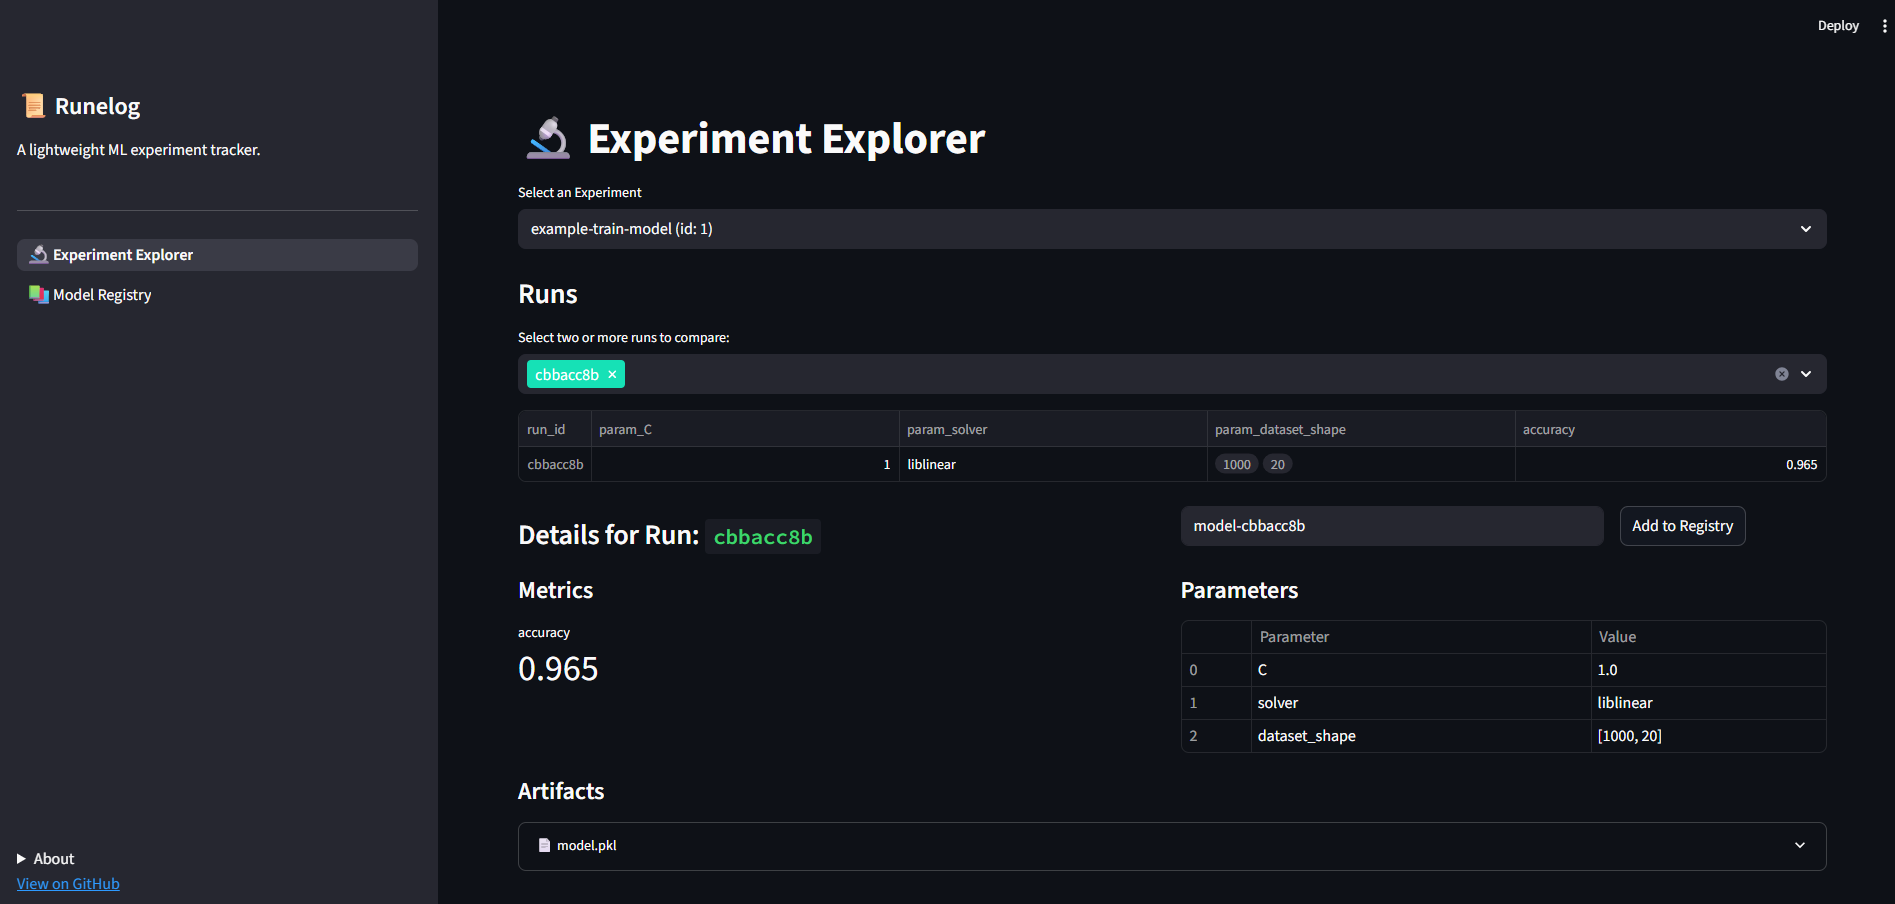
$ runelog runs compare <RUN_ID_1> <RUN_ID_2> ...If you prefer a more visual approach, you can launch the Streamlit UI, which provides a simple dashboard-like experience to compare parameters and metrics across different runs and preview your artifacts. For maximum convenience, you can even run it with a single Docker command or through the CLI as well.
Simplicity as a feature
Although the overlap is significant, RuneLog will never try to be another MLflow. The roadmap is guided by the principle of enhancing simplicity, not adding complexity. Future plans include possible features like self-contained HTML reports for easy sharing, simple model serving for development environments, deeper (but still optional) integrations with libraries like scikit-learn and PyTorch, and more CLI commands.